
Exponential stockpiles
How the meaning of the Cold War nuclear arms race both is and isn't revealed in counting bombs

One of the superficially easiest ways to think about the build-up of nuclear weapons during the Cold War is in terms of the number of weapons that were produced. They make for mind-boggling numbers. The US nuclear program of the 1940s struggled to produce even a few bombs per month; by the late-1950s, it was capable of producing over a dozen nuclear weapons per day. At its peak, the global nuclear stockpiles included something like 65,000 nuclear weapons across all nuclear nations (in 1986), and it has been estimated variously that the total number of nuclear weapons ever produced (keeping in mind that older ones were being decommissioned and dismantled over time) was over 120,000.1
If one looks up data on this, one usually finds a simple graph of warheads. Here are two such graphs that I have made of this data, which originates from sources like the Nuclear Notebook, as well as some official releases by the United States government in particular. Here’s a graph of what might be considered the first half of the Cold War, 1945-1969:2
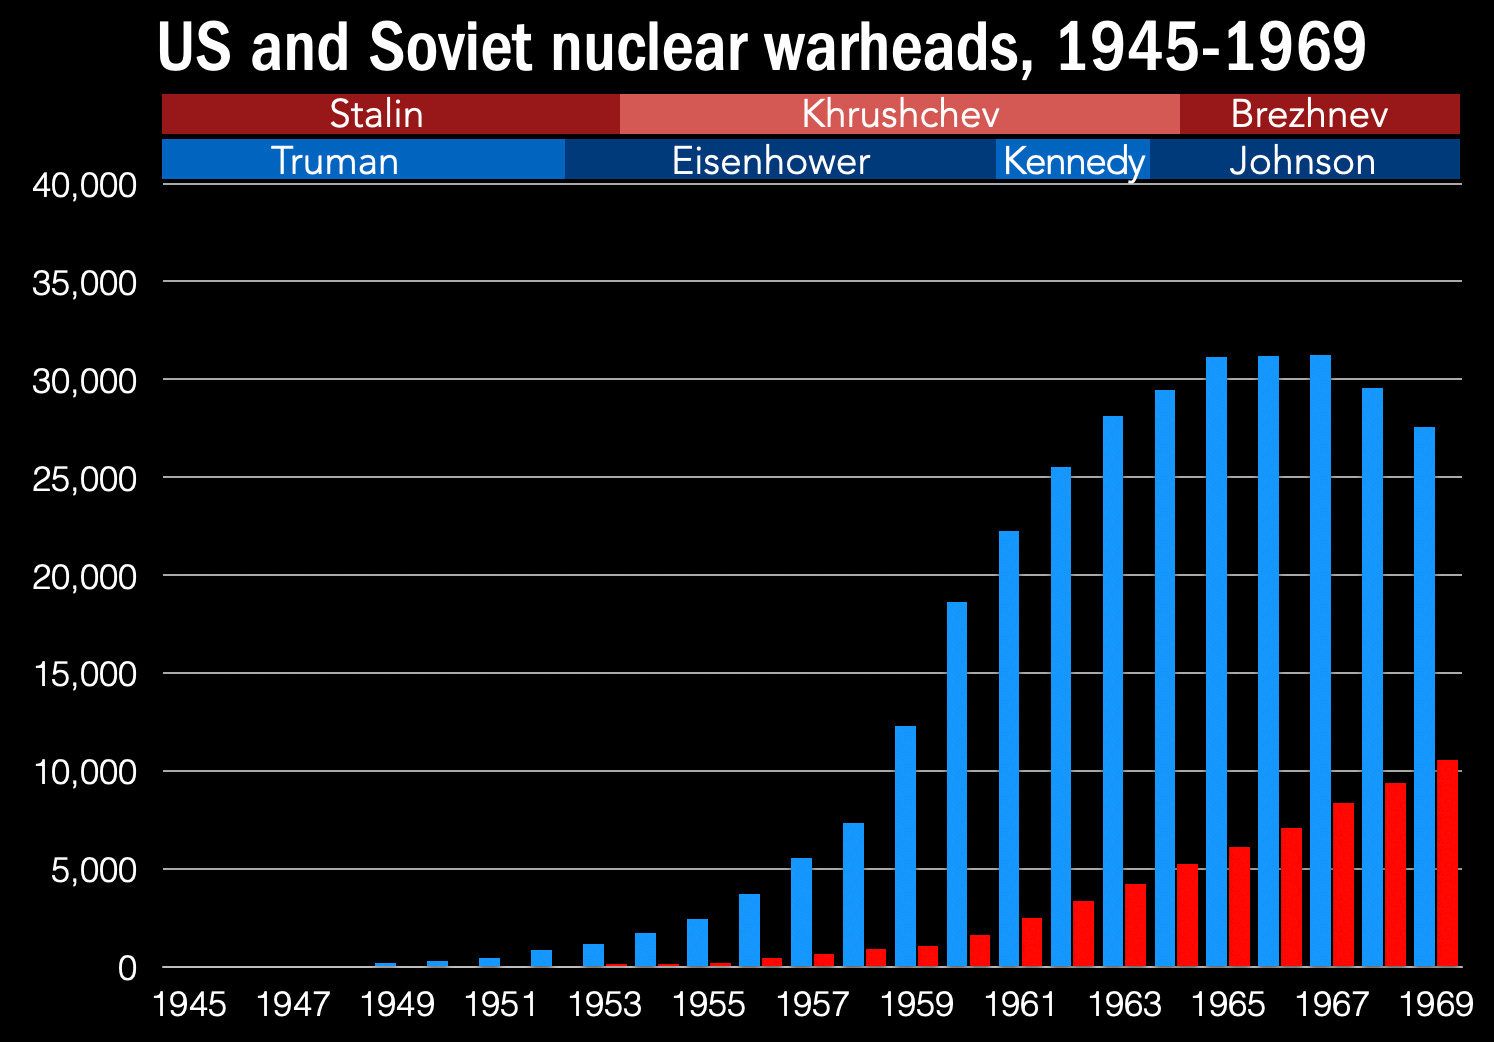
I’ve included the national leaders at the top, just as a means of giving some very rough political context to the numbers. What always jumps out to me about this graph is the plainly exponential nature of the US stockpile size, once you get into the mid-1950s, and then the reaching of a “saturation point” in the mid-1960s, around 31,000 warheads. Some of those year-by-year jumps are astounding. And, of course, the disproportionate nature is something to marvel at: in terms of warheads, the US during this period had a plain numerical advantage several times more than that of the Soviets.
When you look at the rest of the Cold War, separately, the story flips a bit:
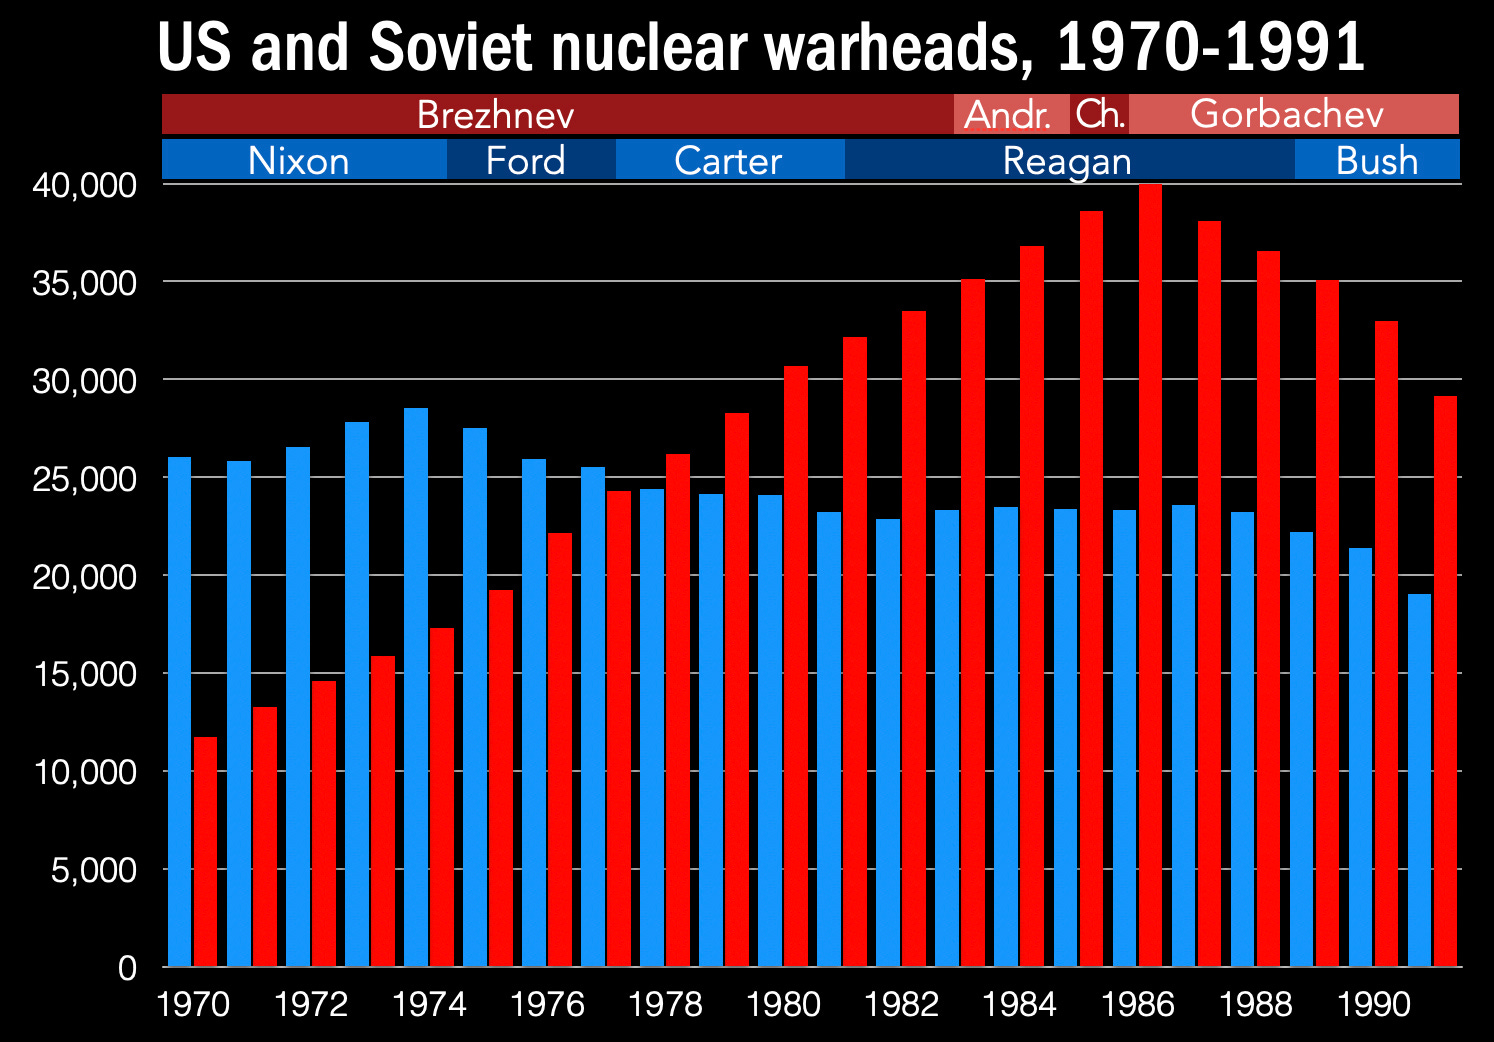
The scale is the same as the previous graph. That slow rise of Soviet warheads simply does not abate until the mid-1980s, topping out around 40,000 warheads. Because the US arsenal numbers appear relatively stagnant, even decreasing, it is easy to come away with the impression that by the 1980s the Soviets not only reached a state of parity with the United States, but even arguably obtained a quantitative advantage.
Assessing what kind of “advantage” that is, though, is harder than this warhead-counting approach lets on. The weapons of the 1940s were all gravity bombs, dropped out of airplanes, but by the 1950s and 1960s a tremendous variety of weapon types were developed, including warheads for a variety of types of missiles, torpedos, nuclear land-mines, and whole “families” of different kind of gravity bombs meant for different targets. Some weapons were extremely high yield (tens of megatons of TNT equivalent), some were (for nukes) extremely low yield (on par with the largest conventional weapons). A nuke is a nuke — but they varied in terms of their destructive power by several orders of magnitude, and were meant for different “roles.”
If we parse the same warhead data, but instead look at the “primary mission” of the warhead, we get a very different type of graph:
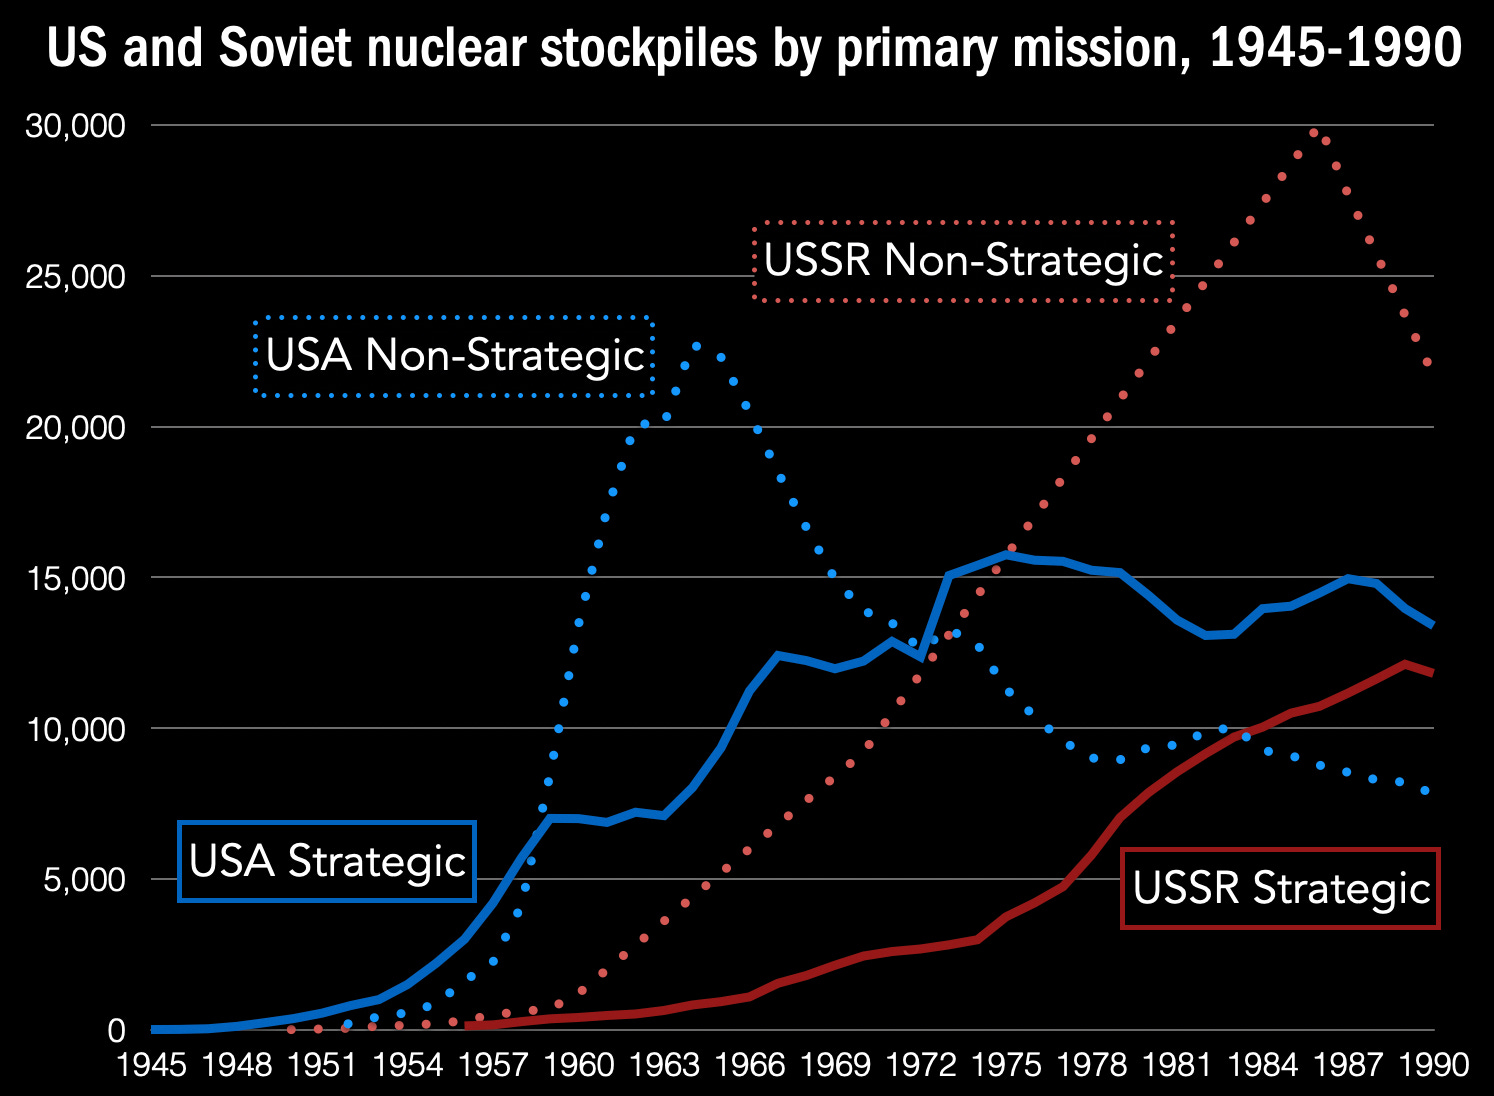
Here I have used estimates of which weapons were designated for “strategic” and “non-strategic” missions.3 These are both tricky and blurry categories, but the essence of them is that a “strategic” weapon is one you are aiming at enemy cities, infrastructure, and nuclear forces, while your “non-strategic” weapon is one you are aiming at specific military units (e.g., tanks and troops and incoming bombers) or otherwise using in a “battlefield” or “defensive” role.
Divided up this way, the data tells a different story: the extreme warhead growth by both the United States and the Soviet Union were in the area of “non-strategic” weapons, not “strategic” ones, which I think contradicts what most people assume when they see the original warhead graphs. This doesn’t make the “strategic” situation much saner: +10,000 strategic warheads is still a lot of nuclear weapons for each side to have had in their stockpiles.
This particular graph changes the narrative of the previous warhead graph in another way: the Soviets don’t actually have more strategic warheads than the United States at any time, and their strategic numerical disadvantage is still pronounced for quite a long time. Of course, one could ask: how important are these numerical differences, after a point? When the US had 15,000 strategic warheads and the Soviets “only” had 3,000, was that difference a meaningful one in terms of actions taken or not taken?
We could parse these kinds of numbers in different ways, as well. The Natural Resources Defense Council produced estimates a while back on the composition of US and Soviet strategic forces:4
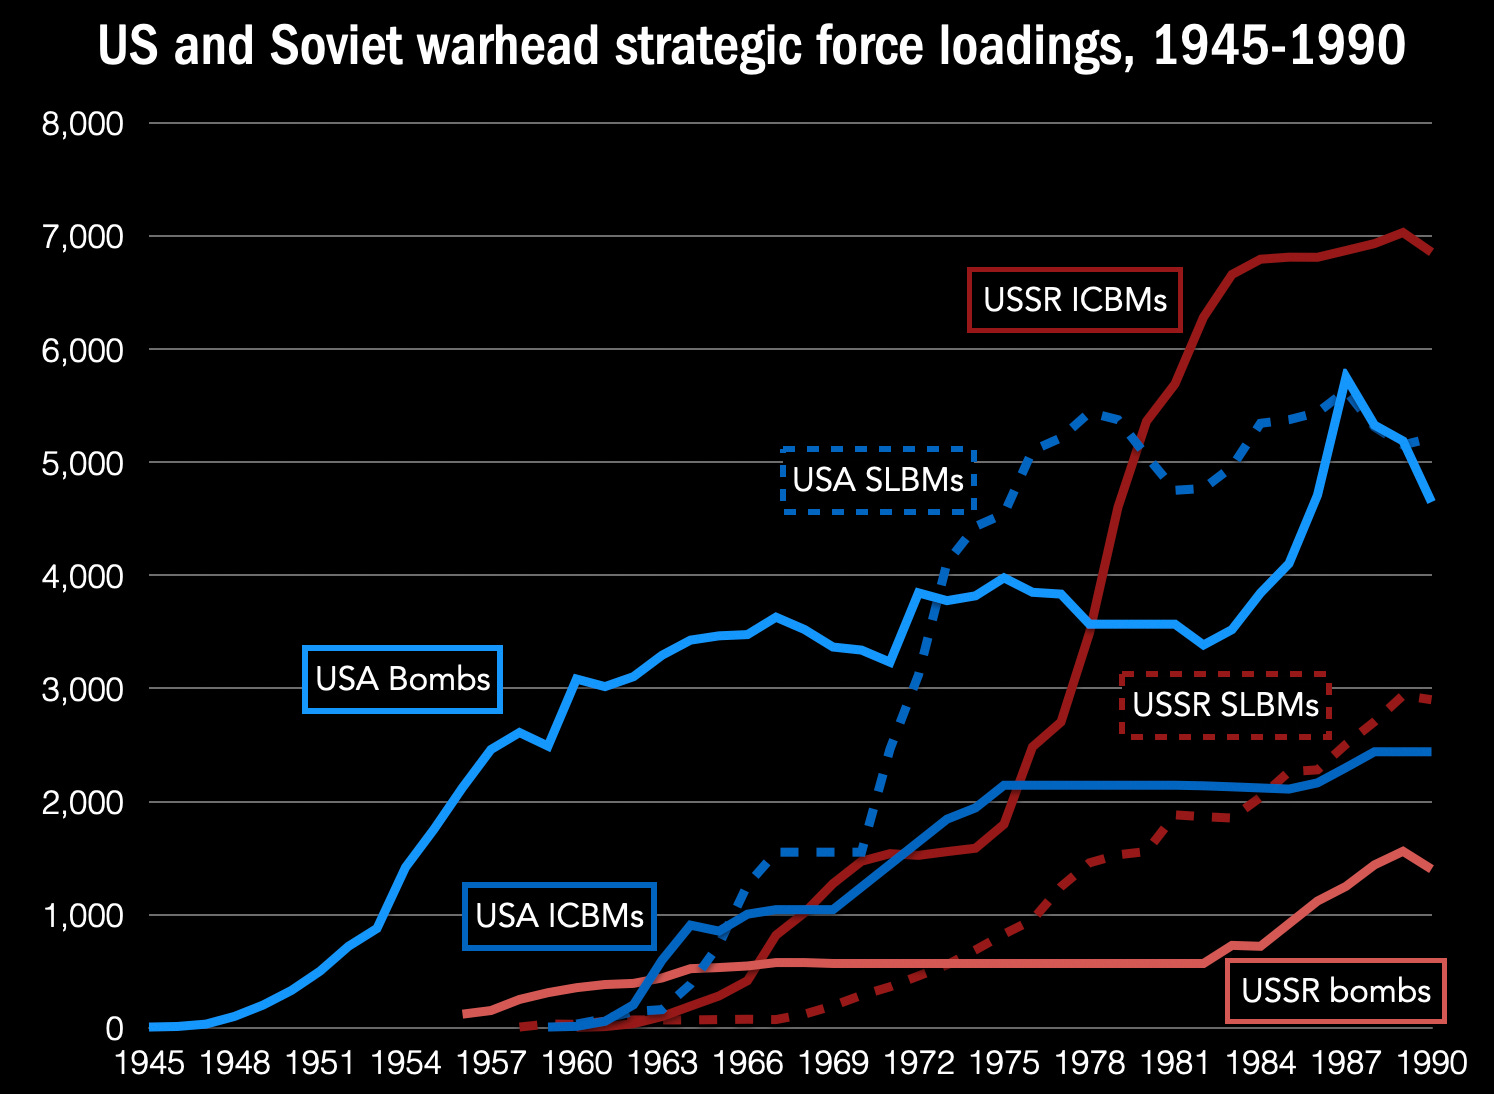
The data here is a bit more speculative, and the numbers across these datasets don’t totally match up, but still, the general trends seem plausible. This is a more complicated graph and warrants a bit of explanation. These are the “force loadings” for strategic nuclear warheads during the Cold War, which is to say, the estimates for how many strategic warheads were deployed on different “delivery vehicles.” It is not an estimate of how many actual vehicles there were — because many of them could carry multiple warheads, especially by the later Cold War. So this gives more of a sense than the other graphs of how many weapons were “in play” at any given moment, and how they were situated.
Some important features jump out from dicing up the data this way. One is that one can plainly see that the US and USSR followed different trends early on: the US was deeply invested in nuclear bombers for its early program, an outgrowth of its World War II approach to strategic bombing, whereas the Soviets primarily saw ICBMs as their path towards a strategic arsenal. (I have previously written a bit about the US side of this trend here.)
Both of these last two datasets also serve up the perhaps surprising conclusion that the Soviet Union did not even have strategic nuclear weapons until the mid-1950s. This is one of those things that both is and is not true — they had a number of gravity bombs in the early 1950s, and where one drops them depends on whether they are “strategic” or “non-strategic.” But the general idea is that the Soviet capabilities for delivering the weapons in this period were so limited that their weapons were, at best, a threat to forces in Europe or Asia, and not the continental United States, which was too far away.
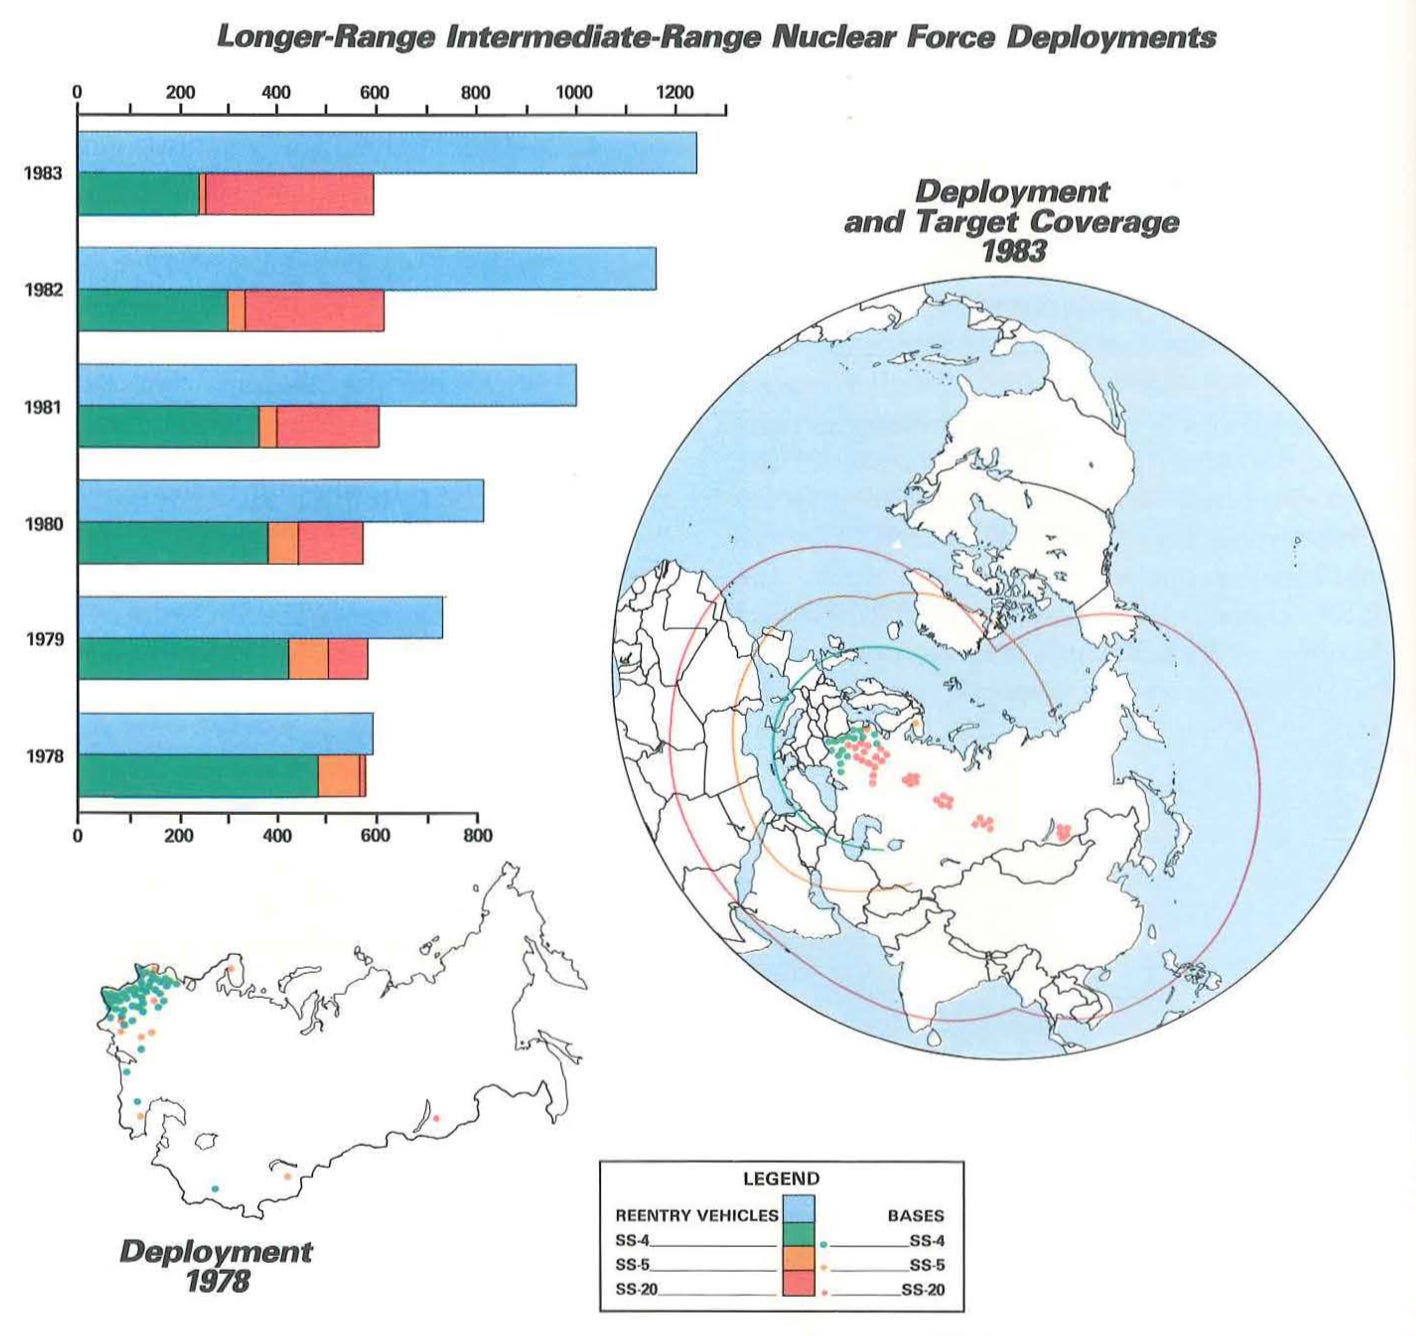
This is where these categories get so tricky. The Soviets invested huge resources into missile categories whose presence in the above data is unclear: intermediate- and medium-range missiles that could threaten both strategic and non-strategic targets in Western Europe. Given their geopolitical position, this makes sense: if you can’t credibly threaten your adversary directly, threaten something important to them, like their friends. Which would be a strategic role, but these aren’t ICBMs. Do they show up in the data estimates in that table? I’m not sure, but I suspect not.
There are other forms of stockpile data we could look at, each of which shed different light on its nature. For example, the US Department of Energy has released data about the total yield of the US nuclear arsenal during the Cold War:5
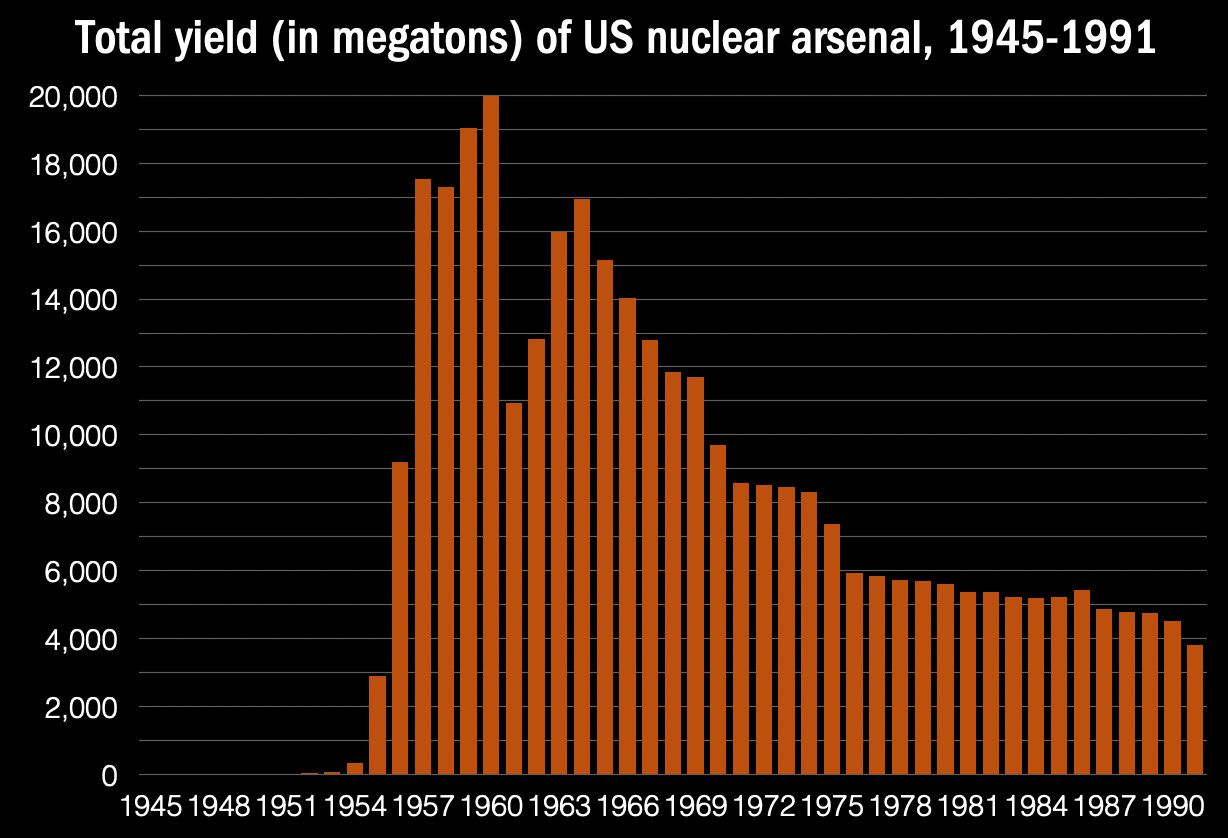
Which is an impressive and frightening bit of data. The “peak” value in 1960 was 20,491 megatons. That’s about 1.4 million Hiroshima bombs, as one way to think about that (or 205 Tsar Bombas, if one wants to go the other direction — though this mostly emphasizes how horrific the Tsar Bomba’s explosive output was). We don’t have a Soviet equivalent of this graph (one could try to estimate it), but one has to imagine it follows its own horrific curves. The global radiological implications of a nuclear exchange involving thousands of megatons is incredible by itself, much less considering the broader ecological and possible climatological impacts from the amount of burning that would imply.
If we take the megatonnage data and divide it by the warhead data, we end up with another interesting graph, showing the average yield per warhead (in kilotons) of the US nuclear arsenal:
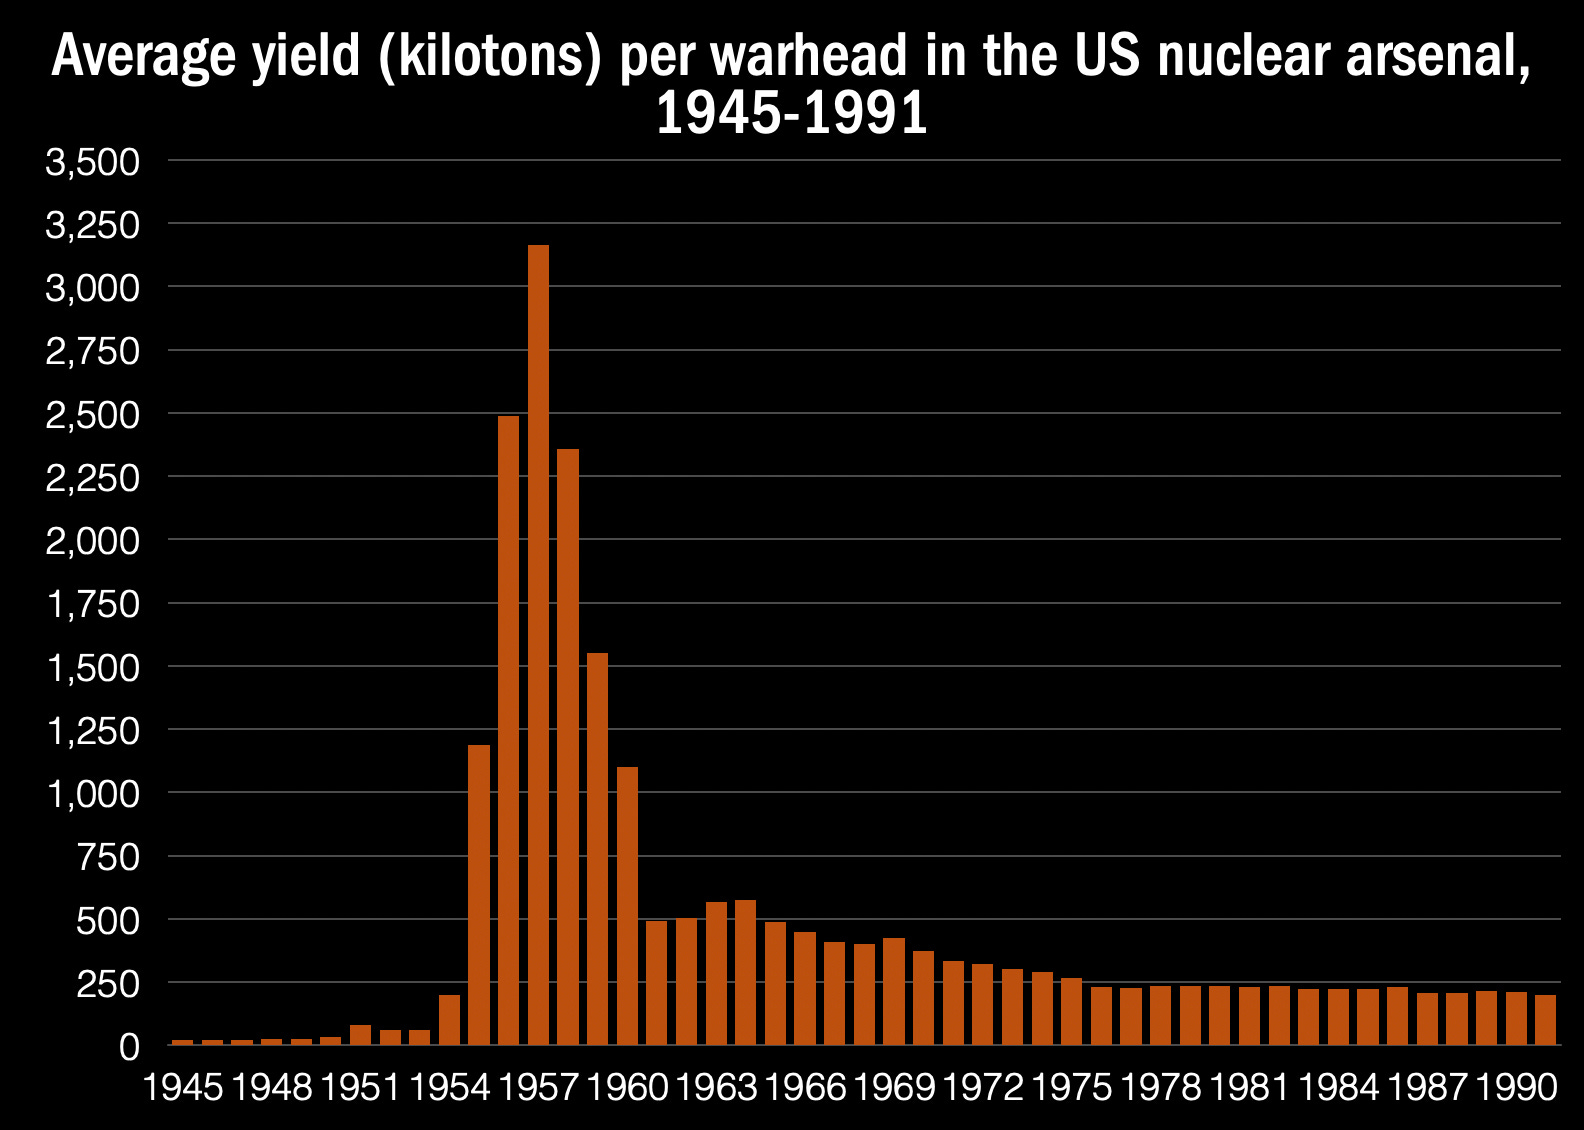
Which tells another interesting (and somewhat different) story, one that dovetails nicely with the observation about the difference between the strategic and non-strategic weapons, but also about changing US weapon priorities. It also highlights something that is often unclear to non-wonks: that late Cold War (and current) strategic US weapons are actually quite lower in yield than the monster H-bombs of the 1950s, because they are optimized for smaller volumes and masses (so that they are easier to deliver to a target). They are still, however, generally many multiples of the weapons of World War II.
One could imagine further parsing up of the data to really get a sense of what the stockpile numbers really mean. And there would be possibly advantages and insights by doing that: even just the data above shifts one’s understanding of things a bit, even in the crudest “number of warheads” form. My sense is that most people who haven’t taken much time to study these issues assume that the US and USSR were roughly at parity for most of the Cold War, but it’s clear that this wasn’t (numerically) the case.
At some point, though, I always feel the need to step back and ask something more fundamental. Like: How many weapons does one need? Is the meaning to be gotten from such data about strategic advantage or disadvantage? How ought we understand the forces that produced these outcomes, something that the data can be suggestive of, but cannot itself actually answer?
I recently read a new article by Benoît Pelopidas and Neil C. Renic that was published in Ethics & International Affairs that made me think about some of these things in a somewhat different way. The article as a whole pushes back on the characterization of the Cold War (and other things) as “tragic”: as an unfortunate thing that could neither be predicted nor avoided. Pelopidas and Renic argue that such narrative framings tend to avoid the sense that choices were made and indeed outcomes were often quite predictable, and that the “tragic” framing tends to erase any sense of “moral agency” from the historical actors.6 They write specifically of the stockpile:
In 1967, the U.S. arsenal peaked at thirty-one thousand weapons. This number should not be portrayed as an unfortunate and unforeseeable consequence tragically driven by the actions of the Soviets, the demands of allies, or the interaction of the two. On the contrary, the nuclear arms race, and the insecurity and enormous expenditures it created, was largely foreseeable: these outcomes were overdetermined by the assumptions made about nuclear weapons and international politics by the players setting the requirements of the nuclear policy they advocated.
They then go into the specific ideas and contexts that lead to arsenals that vastly out-stripped any sense of proportion and “need.” Which is exactly what is really needed to make sense of these numbers, because the numbers and graphs do not speak for themselves. They are, at best, a place to start asking questions. Why do we see the trends we do? What is missing from this representation? Are these numbers accurate? These are questions that history (and disciplines that engage with it) can answer well, if done right. If done wrong, you get either a hand-waving answer (“it was a mutual arms race” — yes, but this is not explanatory of the specific results) or a non-answer (it was a “tragic” result). If done right, you learn something important about the past — and perhaps lessons that give insights into our present, and possible futures.
I have not found a great source for the 120,000 estimate, but it seems about right. US warhead data from the Department of Energy suggests that the total number of warhead “builds” in the USA was 56,474 (see the source in footnote 5, below). The peak US arsenal had 32,255 warheads in it (in 1967). The peak Soviet arsenal is estimated as being a little over 40,000 warheads (in 1986). If we assumed that the total Soviet arsenal was similarly proportioned to the US arsenal, that would suggest there were around 72,300 warheads produced. That might be high — perhaps the Soviets did not cycle through warheads as quickly as the US did — but it clearly had to be some number larger than the peak 40,000, since they did decommission weapons at times. If one assumes that it is the same, that gives you some 129,000 warheads between the US and the USSR alone. The arsenals of the other nuclear states were each smaller (on the order of hundreds) and so would add perhaps another thousand or two to that number. So 120,000 feel pretty reasonable as a rough estimate, given especially the uncertainties about the Soviet stockpile and the way in which, because of its large size, even a small change in percentages gets you a difference of several thousand total “builds.”
The raw “warhead” estimates come from Robert S. Norris and Hans M. Kristensen, "Global nuclear stockpiles, 1945-2006," Bulletin of the Atomic Scientists 62, no. 4 (July/August 2006), 64-66. See also this older post of mine on “Visualizing the Stockpile.” All of the graphs in this article, except otherwise indicated, were created by me, and are explicitly free for anyone else to use without restriction.
These estimates were last updated in 2002 by the Natural Resources Defense Council (presumably Robert S. Norris was involved in this), and are available via the Internet Archive at this point: “Table of USSR/Russian Nuclear Warheads” and “Table of US Nuclear Warheads.”
Same source as in footnote 3.
US Department of Defense and US Department of Energy, “Declassified Stockpile Data 1945 to 1994,” DOE OpenNet (1995).
Benoît Pelopidas and Neil C. Renic, “The Tragedy Trap: On the Tragicized Politics of Nuclear Weapons and Armed Drones and the Making of Unaccountability,” Ethics & International Affairs 38, no. 2 (2024), 209-231.
While my background is in international political economy, getting a PhD in political science exposes one to a lot of what we called "bombs and rockets." In particular, I recall two things that are relevant to this discussion. The first is from a job talk I saw as an undergraduate at the University of Oregon in the late 1970s. The interviewee was a specialist in nuclear affairs, and presented data much like what is presented here. He described the building of both the US and the Soviet nuclear arsenals as an "arms competition," not an arms race. He attributed much of the US pattern as a function of both the miniturization of warheads and increases in accurancy, as measured by declining circular error probabilities for each warhead. Thus more accurate weapons allowed for fewer warheads with diminished yield needed to achieve the same result. The Soviet side, in contrast, was the result of bureaucratic inertia. After the Cuban Missle Crisis, the Soviets built a huge bureaucratic infrastructure to build nuclear missles (as bomber and submarine technology was at the time insufficiently advanced ) to catch up to the US, and in the Soviet system if the state did something it was by defition the correct policy, and if the program was correct there was no reason to stop it. In short, stopping the buildup might imply that the Party was incorrect in some way, and that could not be allowed.
The second was a few years later, when I was a grad student at the University of Michigan. I was picked to serve as a teaching assistant for Jerome Wiesner, who was a visiting professor and had been Kennedy's science advisor. He told me two stories. The first concerned the new Kennedy administration's solution to the "missle gap" problem. In the 1960 election, Kennedy had ran on a platform that included the criticism that the Eisenhower/Nixon administration had allowed the Soviets to surpass the US in constructing nuclear armed missles (an impact of Sputnik), thus a "missle gap" (much like the earlier supposd "bomber gap") existed between the two. Once in power, Kennedy got access to the data, and learned that the Soviets had but a few missles. Yet he had promised to build up the US nuclear missle force. When he asked the military how many were needed, they answered "more." So the discussion centered on a figure of 1000 because, as Wiesner put it, it sounded like a lot.
The second Wiesner story concerns the impact of missle accurancy and the development of MIRV technology, which the Nixon Administration kept out of the SALT I negotiations because they thought that they had a decade or more before the Soviets would develop it (they were very wrong). As Wiesner described it, the guidance system of the standard Minuteman ICBM was a small box stuffed with electronics not much bigger than a shoe box. When MIRV'd, this left sufficient space for three warheads on the then standard Minuteman. The Soviet guidance system, in contrast, was mechanical, and many magnitudes larger and heavier. Thus the Soviets had to build bigger missles to push that less accurate guidance system, along with the warhead, to its intended target. Enter the MIRV technology. Through the 1970s and 1980s the Soviets learned to reduce the size and weight of their guidance systems (in part by acquiring Western dual use technology--hence all the conflict among the US, Western Europe, and Japan regarding technology sales to the Soviets), leaving them with these comparatively huge platforms with lots of space for large numbers of MIRVs. This would be politicized in the US by the 1980 Reagan campaign as the so-called "window of vulnerability," whereby the large increase in the number of Soviet warheads would allow for the possibility of a disarming first strike aimed at US ICBM silos, and leave the Soviets with enough ICBMs to say to the US that they could ride out a bomber and SLBM counter-force strike and still threaten US cities (this was before the deployment of the US D-5 SLBM warhead).
The upshot of all this is to suggest that the pattern of warhead number and yield across the two states may have as much to do with technological change, as well as domestic political idiosyncrasies and rationalities, as with any sort of strategic calculations. It also underscoresas how completely insane the process was.
One subject I would love for you to address, as it deals with modeling, is the model that predicts a Nuclear Winter event with as few as 100 cities targeted.
The reason I'm interested in your take is this - we did an actual 1:1 scale test of this theory when the Allied powers firebombed 77 cities across Germany and Japan in WW2 between 44 and 45. To the best of my knowledge, the late 40's early 50's were not remembered for large scale climate catastrophe that the Nuclear Winter theorists say should happen when firestorms rage through that many cities. I did ask one of the scientists involved about this, and he said it was something they were aware of and looking at, but I never heard anything about this since.
My concern is the whole Nuclear Winter theory is something that is taboo to try to think about critically: You are a monster to suggest it's not real, because if you think it's not real then you are in favor of nuclear warfare, or at least want to make nuclear warfare less taboo to engage in. Who wants to be that monster? Certainly not me... but at the same time, this seems like such a glaring dataset ommission to account for, it makes the science behind it suspect.
I do believe in Climate Science, I do believe in Human Caused Climate Change... but Nuclear Winter I'm giving the side eye to.