The fate of cities
Building a video game model for the impact of a large-scale nuclear war on American cities
For the past several years, I’ve been developing a video game, Oregon Road ‘83. This has been done largely in collaboration with undergraduates at the Stevens Institute of Technology, where I teach, especially students who are in the Pinnacle and Clark programs, which are honors’ programs that allow students to get paid (by the university) to work with a professor over the summer. I have also received financial and logistical support from the Outrider Foundation. Part of the impetus behind Doomsday Machines is to serve as something of a development blog for the game, so I’ll be posting on aspects of it regularly.

In its most basic form, Oregon Road ‘83 is a game that tries to think through and simulate the experience of a full-scale nuclear war. You can think of it as one part Oregon Trail and one part Choose Your Own Adventure book, set after a full-scale nuclear exchange between the Soviet Union and the United States in 1983. In other posts, I’ll explain more about the different aspects of the game and its inspiration (like “why 1983?” and “why a video game?” and “what does this even look like in practice?”).
But to get the ball rolling: in the game, you, the player, are traveling from Independence, Missouri, to the Willamette Valley, Oregon, a week or two after the war has taken place. (You have your reasons.) Along the way, you will need to find and procure adequate food and fuel. Depending on the route you take, this will require traveling through several thousand miles of a recently-devastated country, in which a huge fraction of the population was recently killed, and which is going to likely be still experiencing a total breakdown in every aspect of modern society.
What would that look like? That is the challenge of the imagining the game. One can imagine different “poles” of possibilities, ranging from the Civil Defense planners’ dream (an orderly return to national unity) to your Cormac McCarthyian nightmare (roaming gangs of cannibals). The world of the game exists somewhere in between these two extremes.
In future posts I will describe the various “models” that go into the underlying structure of the game, including our “target set” (what got nuked, with what kind of nuke), the fallout model, the resources (food and fuel), weather and climate, even the model of travel impassability. One of the things I’ve found most stimulating about the game, personally, is that in trying to make it plausibly “grounded,” it has forced me to examine a lot of details that are typically overlooked in thinking about nuclear war, but to do so at a very “functional” scale. I’m not trying to do a perfect simulation, but I need something that is “good enough” for the kind of game I am making. The level of complexity needs to be enough to be useful and nuanced, but also simple-enough that it is neither ruinous to try to implement it, nor so overly complicated that a player would find it taxing to understand.
As a basic example of this, one of the questions I’ve spent a lot of time contemplating is: What is the fate of an individual city within this world? Most people tend to assume that all cities would be instantly glassified, but this is not a very realistic assumption, just based on the capabilities of the weapons or what they would be aimed at.
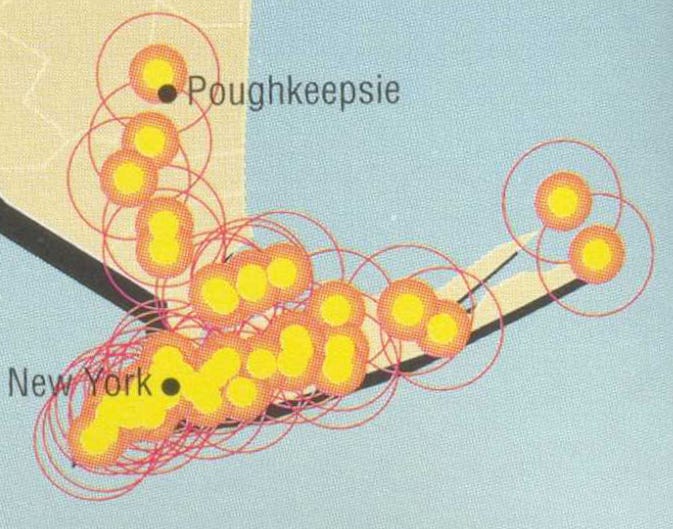
In some parts of the country, a model of “totally destroyed, totally ruined” applies to large metro areas, for sure. Look, as just an example, of how FEMA conceptualized the possible nuclear attack threat to the New York City metro area in 1990:1
Now, one could get into what exactly this is meant to represent, and whether it is in any sense “accurate,” but the basic point has been made, I think. If you want to consider the above “totally destroyed, no hope for survival,” I’m not going to contest it. This is one of several reasons why game of this sort set in the Northeast would be very different from one set in the West.
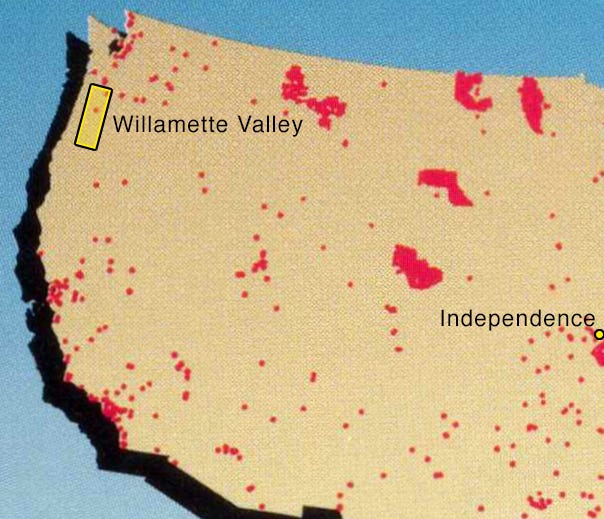
Here is FEMA’s overall target map of the country for their 1990 report:
I’ll write more about this particular FEMA report — its origins, assumptions, issues, etc. — in the future. I don’t take it as gospel, at all. But I’ve found it very useful as a way to conceptualize how US emergency planners thought about what a full-scale nuclear attack against the United States during the late Cold War might look like.
For example, a few salient features from the map above jump out:
You have some regions, like the Northeast, where the concentration of urban targets is incredibly, almost unimaginably dense. E.g., the Boston-NYC-Washington corridor, the industrial centers of the Great Lakes regions, the major coastal regions of California, and the Gulf Coast cities.
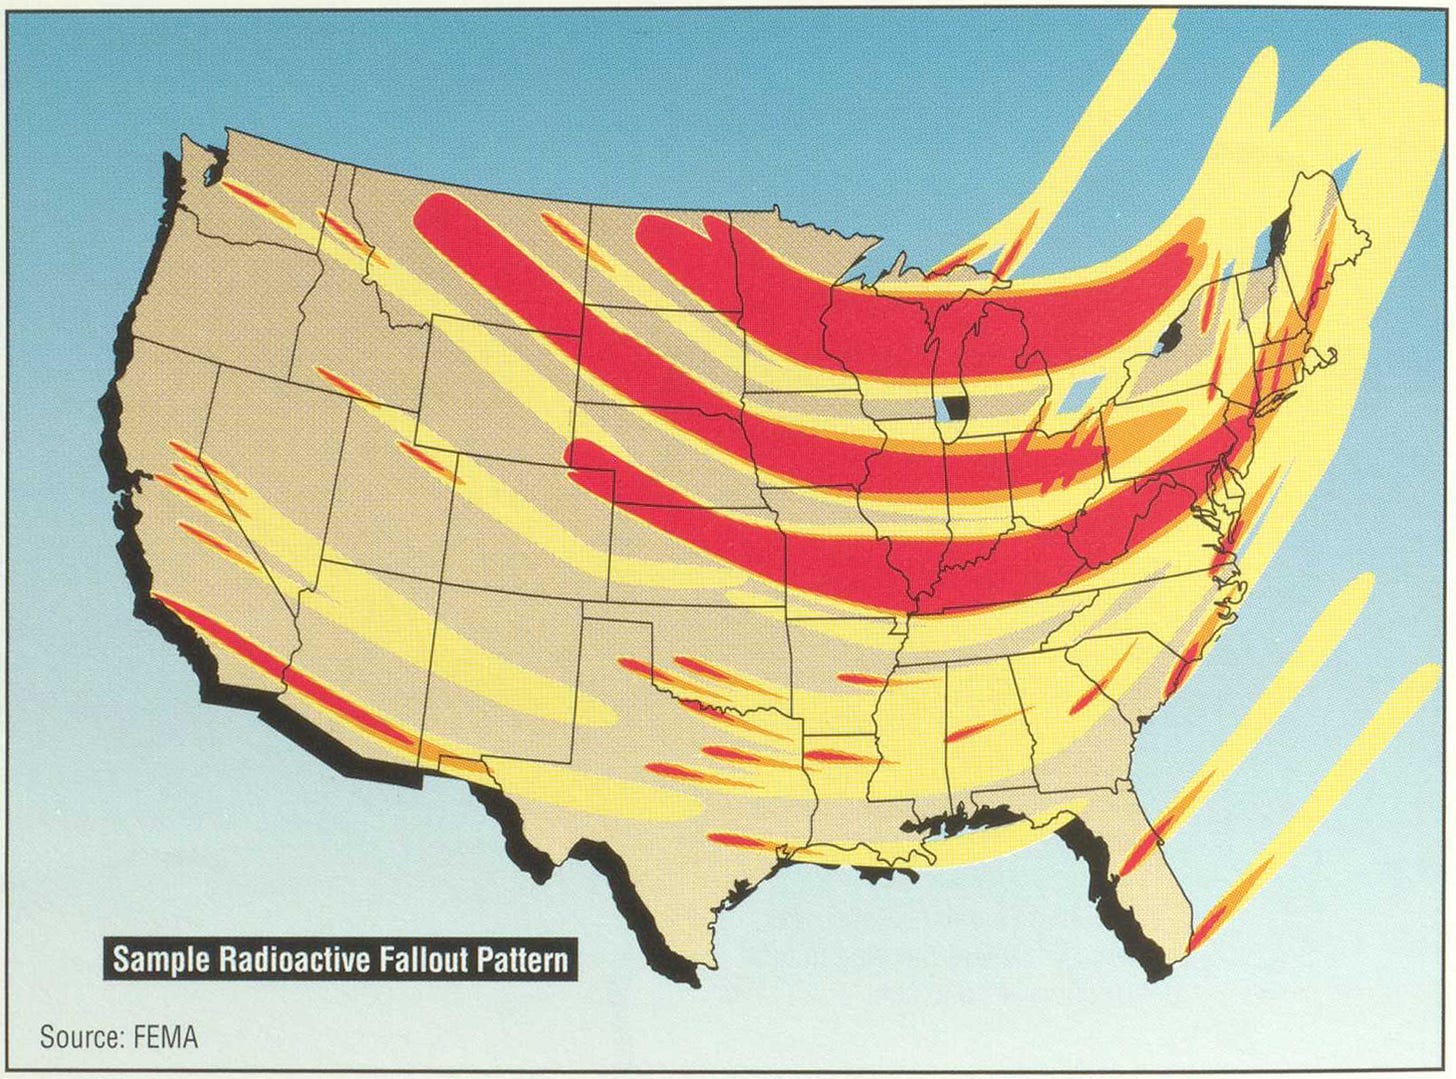
There are also a few zones of dense targeting in the center of the country. These are ICBM fields, where the FEMA assumption was (rightly or wrongly) that individual missile silos and their launch control centers would be targeted by the Soviets in an attempt to possibly preempt the US ability to retaliate. In the above image, there are six such bases; in 1983, when the game is set, there would be additional Titan II bases. The FEMA model assumes quite explicitly that these would all be surface bursts, targeting hardened silos, and so would necessarily create a lot of fallout. They give a “sample radioactive fallout pattern” which makes this quite clear:

While the number of possible targets is very high, there are also a lot of places that are not targeted. FEMA did not think (again, rightly or wrongly) that the Soviets were trying to target every city in the country. Most major metropolitan areas are targeted in the FEMA model, either directly or because they contain other “strategic” targets within them. But there are many small and mid-sized cities that would not be directly targeted.
Even large cities that would be directly targeted in such an attack would not be 100% destroyed. There would be survivors, to greater and lesser extents depending on the circumstances (area of the city, population of the city, number of weapons targeted at it, yield of weapons targeted at it, location of ground zeros, etc.). I say this not to underplay what the horrors would be. At Hiroshima, around 25-50% of the population were immediately killed or injured by the atomic bomb, depending on the estimates one goes with of pre-attack population and numbers of dead, and that was more than enough to make it a hell on Earth. But there were survivors, and it is their stories that we tell. For a game that is trying to model the state of survivors after a nuclear war, this is important to keep in mind.
For Oregon Road ‘83, I wanted to come up with a pretty simple model for thinking about how the fate of any given city in our targeting scenario would translate into conditions in the city a few days-to-weeks after the attack. In particular, how this would impact resource availability, particularly the two resources we are having the player track during the game: food and fuel (gasoline).2 The area the player will be capable of traversing through in the game is approximately this part of the map:
Because one is primarily taking highways, one will be forced to pass through or near a lot of cities. Some of them will have been directly targeted, some of them will not have been. Some of them will have been in the path of significant amounts of fallout, some of them will not have been.
So as a very rough model for thinking about the fate of these cities, I came up with the following metric.
Each city in the game has a population and a population_density variable, from which a rough area can also be derived. These are derived from the 1980 census and reflect its pre-war state.
The game has a “target model” within it of every nuclear detonation that we are imagining took place in our hypothetical war, meticulously plotted on the map. Because we also have a sense of the city’s size (from the area variable), we can use the number of weapons in or in close-proximity to the city to derive a damage_level, which reflects the direct physical (blast, fire) damage to the city during the war. Right now, this is very simple:
0 = No nuclear weapon went off in or near this city.
1 = Very few weapons went off near the outskirts of the city, and the city was of sufficient size that we would expect only part of it to be damaged, with the other parts being essentially functional. People might reasonably ask, is this even possible, to have “minor” damage from a nuclear weapon? It depends on the size of the city, the size of the weapon, and the target of the weapon.
2 = One or two nuclear weapons went off in the central area of the city, and the city’s area is small enough relative to the size of these weapons that mass destruction would be expected. Or, the city is quite large, but sustained multiple nuclear detonations throughout it.3
You can think of this, clearly, as “no damage,” “low damage,” “high damage.”

There is also a separate variable, fallout_level, which tracks the amount of radioactive fallout the city would be expected to have received. This is derived from out fallout model (which I will describe in a future post), which itself is derived from attack model. Our city model takes the raw fallout intensity calculations and, as with damage, simplifies them down to a simple scale:
0 = No significant fallout. By “significant” we mean “likely to have had, or have, significant, acute health impacts.” So we are imagining that this place had a total exposure dose < 100 rem.4 This is a somewhat arbitrary cutoff, but 100 rem is around the area where people who did not have adequate shelter would suffer from radiation sickness, but probably not die, so for areas less than this we would not expect widespread, immediate health impacts from fallout.5
1 = Some significant fallout. The people in such areas would have possibly gotten sick if they did not take adequate shelter. Some may have died, but not a lot. We are imagining a place where the total exposure dose was >=100 rem and <=500 rem. Again, these cutoffs are recognized as somewhat arbitrary.
2 = Considerable fallout. If the people in this place did not take shelter adequately, most of them will be either dead, dying, or sick. Total exposure dose >=500 rem and <=1000 rem.
3 = Extreme levels of fallout. Even with shelters (of the sort built by and available to civilians), the radiation levels are high enough that illness is likely and death is possible. Without shelter, death is inevitable and probably has already occurred. Total exposure dose >=1000 rem.
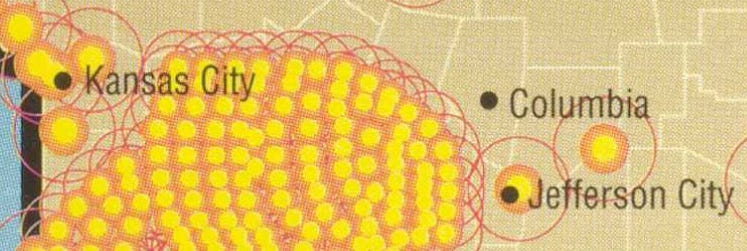
So the state of a given city is reflected in the combination of these two variables, damage_level and fallout_level. They are not necessarily correlated. Consider this detail from the Missouri map from the FEMA report:
Kansas City would clearly have a damage_level of 2. Lots of targets in and near it. But what is its fallout_level? If those weapons targeting it are airbursts, then they might not be generating much fallout directly. But if Kansas City is downwind of surface bursts, then it might be a problem.
Consider, as well, the differences between Columbia and Jefferson City. Jefferson City is a pretty small place (a population of around 10,000 in 1980), but had something in it that FEMA thought might be a target. (In this case, I suspect it is either its airport or national guard base that FEMA thought would be a target, here.) Jefferson City is probably small-enough that any nuke is going to put it into the damage_level of 2, but we could imagine larger cities with a similar sort of target on the outskirts that might have a damage_level of 1.
Columbia, in FEMA’s model, is not targeted at all.6 So it would have a damage_level of 0. It had a population of around 60,000 in 1980, and so would have significantly more people than Jefferson City.
But both Jefferson City and Columbia are extremely downwind of those silo-targeting nukes to their west, at Whiteman Air Force Base, so it’s easy to imagine that their fallout_level would both be in the 3 (extreme) territory.
So how would these three different cities vary in their outcomes? Let’s start with the smaller cities. Jefferson City would suffer a lot of physical damage for its size, and also extreme fallout. I would assume very few of its population survived the combination of the two. I also would expect that its small size probably meant that any “reservoirs” of resources (markets, gas stations, etc.) probably were destroyed, as it didn’t have that many of them to begin with. So if the player were to visit Jefferson City, they would find it pretty “dead,” and pretty “empty.”7
Columbia, on the other hand, is unscathed from direct damage. But it has suffered heavy fallout. How many of its 60,000 residents had adequate shelter available to them, and properly took it? This is a complicated question, and I’ll come back to it when I write about our fallout model, but my personal guess is not that many. If that were true, Columbia would be pretty “dead” but — and this is important — not “empty,” in terms of resources. Its markets and gas stations might be relatively “full,” because the starting capacity was relatively high, did not get physically destroyed by the attack, and might not have that many “consumers” in the days after the attack… because the area would be acutely dangerous to anyone trying to “consume” such things in that time.
The Kansas City metro area had a much larger starting population and area than the others, at over 1 million people in 1980. Its damage_level would be extreme, however. Let’s just imagine, for the sake of argument, that 80% of the population was killed by the attack within the first week. That would leave around 200,000 people in the KC metro area — still quite a lot. The physical damage would be extensive enough to destroy a lot of the stored food and fuel sources. Our model would assume, however, that the starting amounts of both (pre-war) were pretty high. But with that much damaged supply, if the fallout exposure was not acutely dangerous, one would expect the number of resource “consumers” in the area to be pretty high. Thus by the time our player arrives, the total available resources would be pretty low.
Thus we end up with a somewhat nuanced, but still not too complicated, model for thinking about the fates of cities. There are interesting and somewhat unintuitive consequences for this model, ones that are present in some of the more fine-grained government studies of nuclear war. For example, consider a city with a damage_level of 0 and a fallout_level of 0. One would think this would be an ideal situation, totally unscathed, right? Except that we are assuming in our model that food and fuel supply logistics were totally disrupted by the attack, so this is a place where the number of resource “consumers” would be very high. So this is where starvation and deprivation are going to be the worst, and from our player’s point of view, perhaps the most dangerous kind of place to pass through.
Of course, this underlying model will be hidden from the player. But the goal is that its impacts on the “world” can be conveyed in numerous ways (through experience, through conversations with survivors, etc.) that will be discovered through play. Because ultimately, the goal here is not to create a simulation for its own sake, but to create a game that can, through intuitive play, lead to deeper and more concrete imagining of what a nuclear war would really do. Because aside from being untrue and overly simplistic, the “everything would end in a flash” model that most people tend to have in mind is an active inhibitor, I believe, for taking seriously the weapons, the possibility of their use, and the consequences of their use.
The game is still in active development — we are pushing this summer to have it ready for a state where we are able to open it up to some early players within the next few months — and so the above is still subject to change. If you have thoughts on it, let me know.
Federal Emergency Management Agency, Risks and Hazards: A State by State Guide (FEMA-196, September 1990).
We are not, at present, considering “water” a separate resource from “food,” though early versions of the game did. Ultimately it just felt too fiddly to have an extra resource to track, one more number for a player to worry about among the other numbers and things they have to keep in mind. This is one of those difficult compromises that comes up when trying to turn a “grounded” model into a “game” model, where the simulation has to be simplified for the purpose of playability. I will write more on post-nuclear eating and the fuel availability problem in the near future.
Early on, I had an intermediate category between 1 and 2, for cities that that received a nuclear detonation in a central area but were large-enough to still be functional, but after looking more closely at the FEMA map, NUKEMAP, and the yields of Soviet nuclear weapons that were available in 1983, I found no obvious candidates for a city that would be in that situation. All of the cities with a single nuke in their center were pretty small relative to the size of that nuke, and would be in a pretty bad situation. There were no cities of large area that were only targeted by a single moderate-sized nuclear weapon among the list we were looking at.
The fallout models (and most of the historical documents) I use all use rem (roentgen equivalent man) as their unit for equivalent dose of radiation. Today the Sievert (Sv) is the commonly-used unit, but as someone steeped in the historical literature I find it somewhat less intuitive. It is easy-enough to convert them: 1 Sv = 100 rem. Note that for the purposes of health effects, equivalent dose is not always the best approach; absorbed dose is sometimes better, and measured in different units (rads and Grays). For the purpose of the game, we are treating equivalent dose and absorbed dose as equivalent, as a simplification and also because this was often how it was treated in Cold War approximations as well (e.g. 1 rem = 1 rad; 100 rad = 1 Gy), as the differences matter a lot less when talking about bulk population exposures to fission products.
Note that the words “immediate” and “acute” are doing a lot of work here. These areas may not be “habitable” over the long-term, because of contamination and chronic fallout risks, and the people in these areas, depending on their exposures, might be expected to suffer longer-term health impacts like birth defects and cancers. For the purpose of the game, we are only modeling health impacts that would manifest on the scale of weeks. The game will, of course, make salient the more long-term concerns in various ways.
Interestingly, in an earlier version of this same kind of assessment — the DCPA’s High Risk Areas: For Civil Defense and Planning Purposes (Defense Civil Preparedness Agency, 1975), they imagined that Jefferson City would not be targeted directly, but Columbia would. Which just highlights the trickiness of these kinds of “models”!
The player cannot, in fact, visit Jefferson City and Columbia in the game, because we force them to go West. But they do visit Kansas City.


Is that a Saab 900 you get to travel cross-country in??
With regards to the fate of cities, what degree of flammability would one assume for a modern US urban area? Will the inner concrete core burn less than industrial areas or the suburbs? Certainly a modern city wouldn't burn in the same way that Hiroshima did - or would it? The level of flammability would be another variable to be considered in assigning levels of damage to urban areas. Also, if one subscribes to the nuclear winter theory urban burning will have a deep and dramatic impact within the time frame of the the trek across the US and afterwards.
I keep remembering the footage of the test house exposed to a surface nuclear burst in Nevada. You see the structure being to burn under the glare of the heat of the fireball , then the blast wave essentially wrecks the house but stops the burning (or so it seems).