The Big Board
How does one visualize the scope of a full-scale nuclear war?
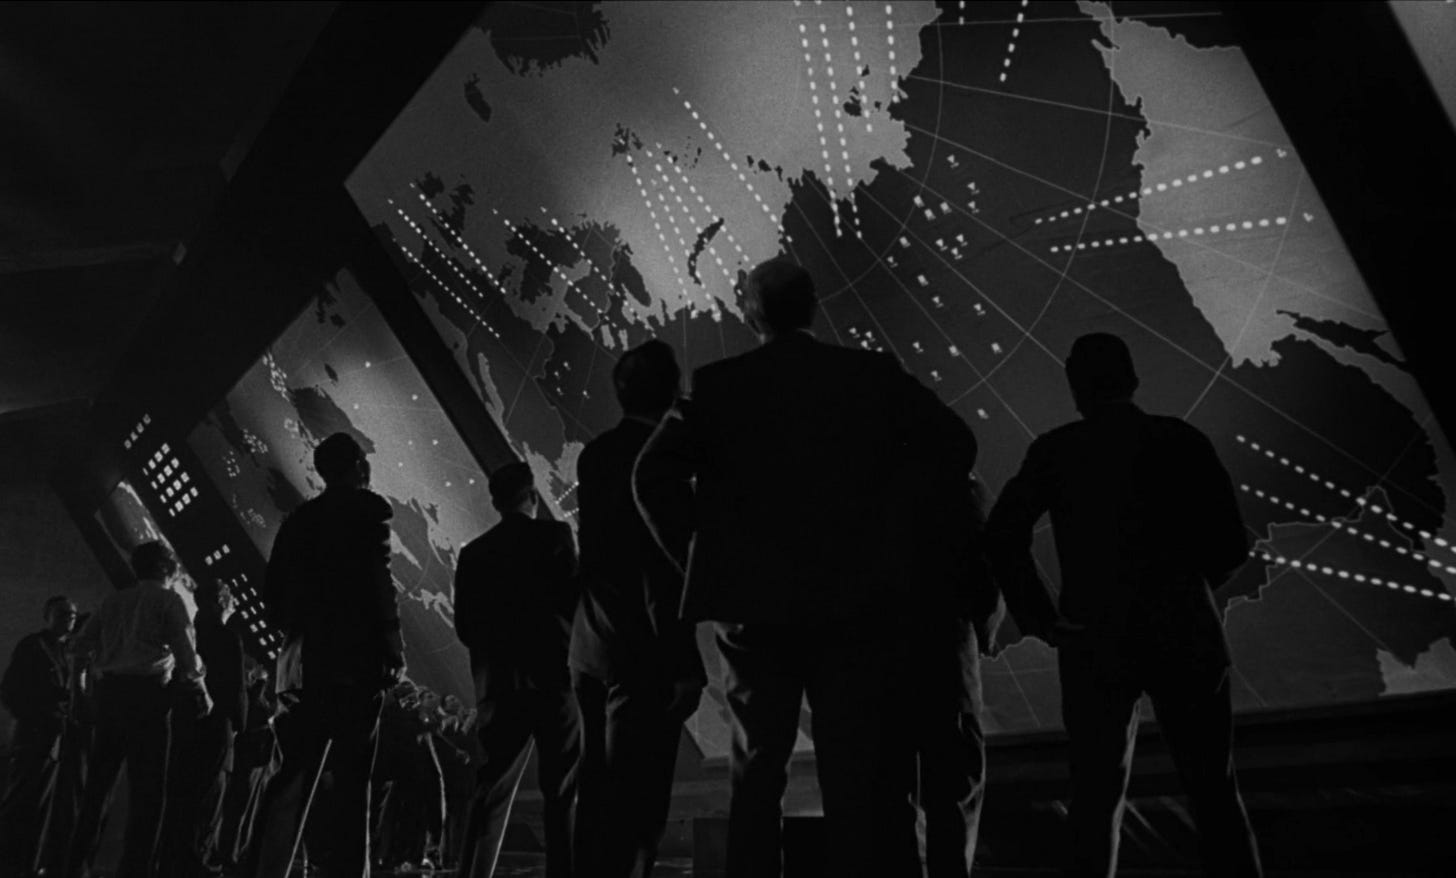
Last week, I took a look the War Room set from Stanley Kubrick’s classic, Dr. Strangelove, Or: How I Learned to Stop Worrying and Love the Bomb (1964). One of the great features of production designer Ken Adam’s set is The Big Board, the massive maps that show the progress of American bombers on their ill-fated attack run:
It’s justly a classic set piece, and allows the characters (and the audience) to vividly see the scope of what they are up against, represented as lines and icons on a gigantic, looming map.
In a later interviewed, Adam explained how the Big Board was made and the practical problems that were involved in them:1
So I came up with these gigantic maps. The problem was how to create them. We drew them out on an imperial-sized drawing board and, because we had the technology for photographic enlargements, blew them up to this enormous size. The next problem I had… was how we were going to make these symbols of nuclear bombers approach Russia. I remember Stanley [Kubrick] and I driving to Pinewood where they had a very famous rear project man called Charlie Staffel who said he could do it with 16mm rear projectors. We calculated that we needed twenty-four projectors. As we were driving back Stanley said, “That’s going to be a disaster.” So we used actual light bulbs instead. […]
But I did make a mistake because I mounted the photo maps on plywood, built a light box behind it with hundred-watt bulbs, and then put perspex over the box: imagine a gigantic sheet of plywood, cut out in a little square which is then covered with perspex, and put the photograph on top. What I didn’t realize was that there was so much heat generated by all these bulbs — there were at least a thousand — that the photographic material was blistering away from the perspex. So we had to come up with various air-conditioning ventilation units to cool it down.
Sidney Lumet’s Fail Safe came out the same year as Dr. Strangelove, and covers much the same ground (to the point of litigation), albeit played straight and with less style. It too featured a Big Board:
Unlike Strangelove’s rigid-but-stunning Big Board, the one in Fail Safe Big Board was a hand-drawn animation meant to simulate a computer screen. As Lumet later explained, its inclusion was a true necessity for the film:2
We could not get a picture of SAC [Strategic Air Command]. We could not get a picture of the interior of SAC, where those screens were. […] I needed footage of bombers, and this is footage that is available from rental houses. We couldn’t get anything from the government. Then we went to the rental houses, which had the stuff. And by that time, we couldn’t get anything from the rental houses, not a foot. The plane that you see in that movie is one shot that we boot-legged. The five planes that you see taking off are all the same plane. Not just that the government would not give us cooperation […], but that they cut off the rental houses is extraordinary. That in turn led us to this very simple, almost simplistic way of portraying the invasion of Russian airspace. That footage was done for us by two great animations, John and Faith Hubley. Hand animated! We were doing that because it was the simplest and least-expensive way to draw it, and make a little white cloud every time one of them [the cities] got hit.
And it’s true that Fail Safe’s Big Board was much more dynamic that Strangelove’s — ironically so, given how rigid the rest of the film feels by comparison.
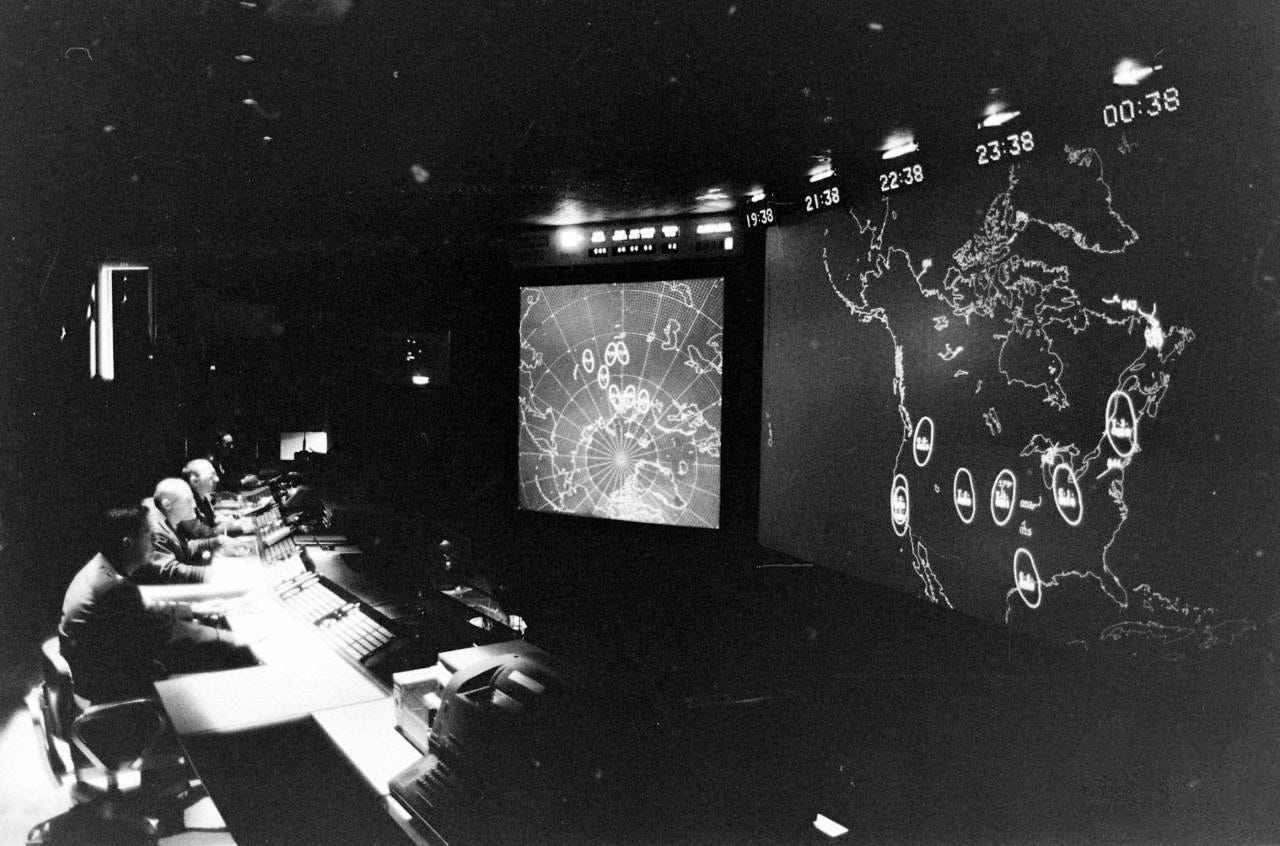
In the previously cited interview with Adam, he explained that NORAD was the source of inspiration for Strangelove’s Big Board. The Command Center at NORAD, the agency tasked with detecting incoming Soviet attacks and coordinating defensive measures, was (unlike SAC’s) part of public knowledge. It was, for example, profiled in the March 1, 1963 issue of LIFE magazine:

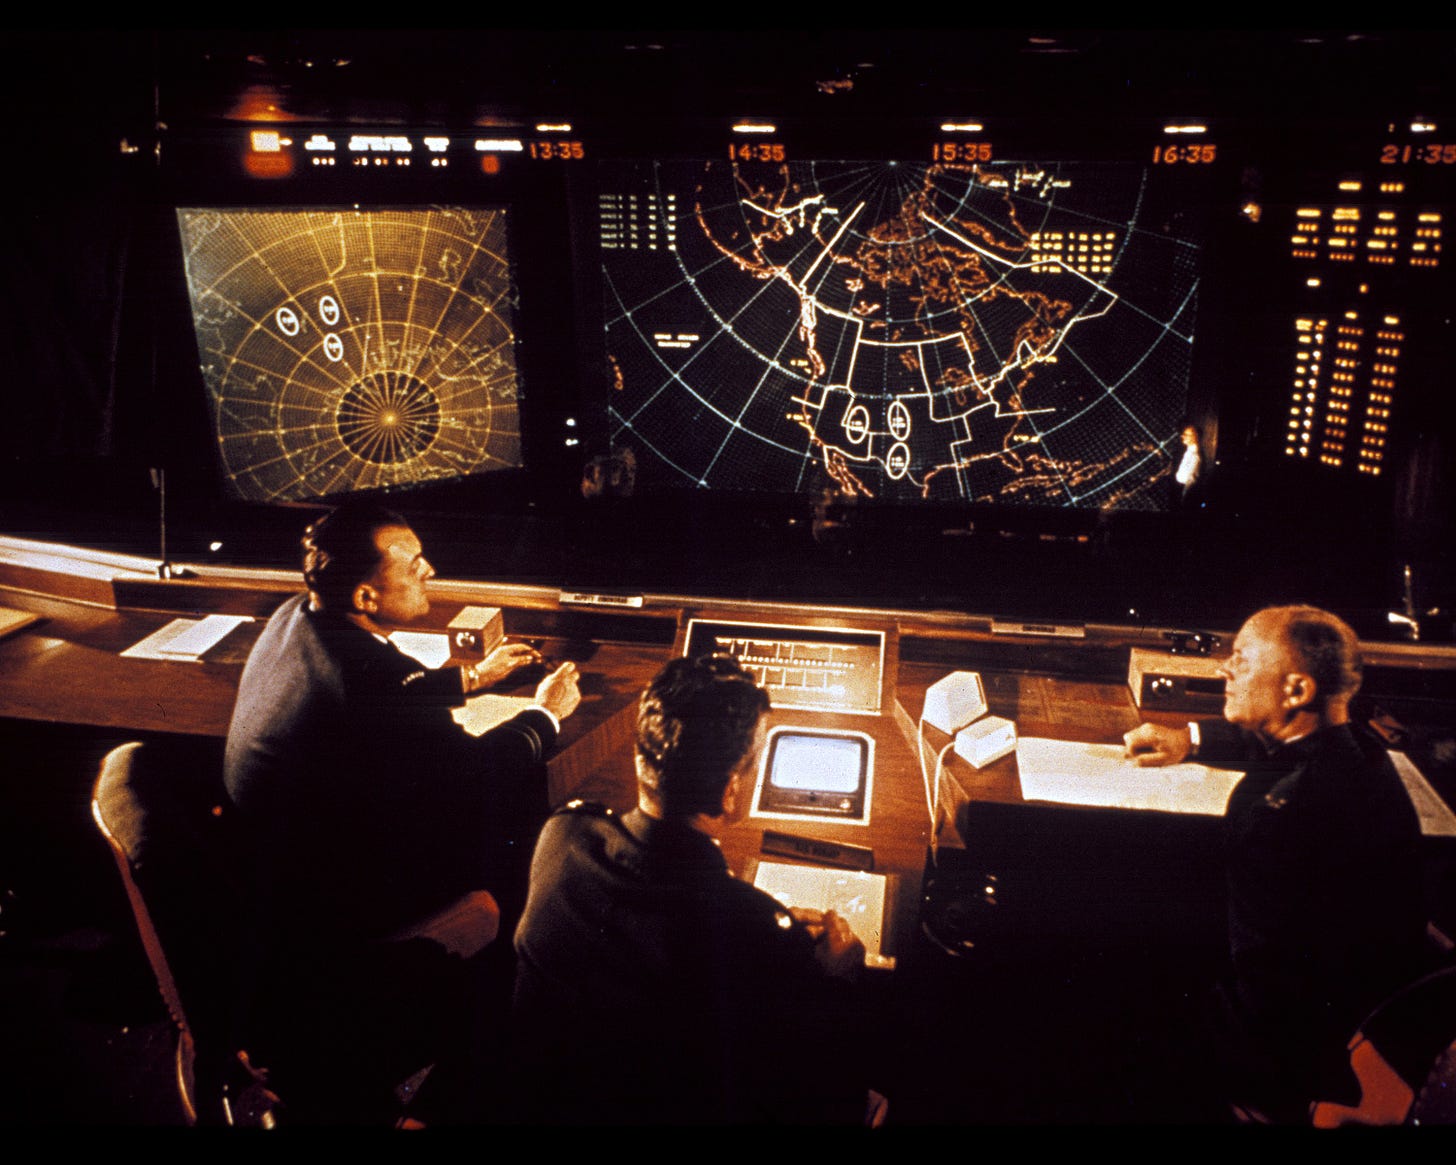
There is also a (rare) photo of the Control Room in full color:3
The NORAD Big Board was clearly more information-dense than the one in Dr. Strangelove. The system powering it was called Iconorama, and was used in various defense-mapping settings from the late 1950s through the 1980s.4 A 1965 report described the Iconorama system, with explicit reference to the above photograph:5
This information [about an ongoing attack and defensive responses] is electronically displayed by a system known as Iconorama. The system permits almost instantaneous observation of the positions of aerospace and seaborne objects thousands of miles away and over any part of the continent covered by radar networks. Iconorama flashes surveillance information on a large, theater-like screen for easy observation.
On this screen is a map of North America, the surrounding oceans, Greenland, Iceland, parts of Siberia, and the Caribbean Islands. Symbols show the location and direction of travel of all aircraft of special interest to NORAD. These may be strategic friendly elements or a commercial or military aircraft that for one reason or another is classed as an unknown until positive identification is made. NORAD is interested in unidentified submarines, friendly aircraft carriers, Soviet fishing trawlers, and air activity over Cuba and Siberia. All this is presented on the main display with special coded symbols that provide a variety of information about the subject.
To the right of the main display is the weapon status board. This is associated with the main display, and information on the board is received, processed, and displayed automatically. The top part of this board, referred to as the "commander's box score," shows at a glance the number of hostile aircraft in the NORAD system, the number of unknowns, the weapons committed to these tracks, the kills made, and NORAD losses. Below is a listing of worldwide major military commands and their defense readiness conditions. The bottom part of the status board shows the number of weapons available to NORAD on 5-minute alert, including fighter-interceptors and surface-to-air missiles.
To the left of the main display is the BMEWS [Ballistic Missile Early Warning System] display. At the top is the threat summary panel providing, under conditions of attack, the number of missiles predicted to impact on North America and the time remaining before the first or next missile. The lower part of the BMEWS display is a map of Europe and Asia as seen looking over the North Pole from North America. On this map the launch areas for incoming ballistic missiles will show as ellipses. Corresponding ellipses appear simultaneously on the main display and show the predicted impact area. These three displays provide up-to-date information to the [NORAD Commander] and the battle staff at all times.
Another such system, which must have predated the NORAD command center shown above, was used in SAGE, the Semi-Automatic Ground Environment. SAGE was a massive computer system built for NORAD in the late 1950s by IBM, and was the first major attempt to use computers to connect a variety of different kinds of sensor data (e.g., from radars) to create a coherent picture of a possible bomber attack:6
The above photograph shows the SAGE command post at Hancock Field, New York. This was apparently taken during equipment installation, so I’m not sure the Big Board is even turned on, but even if it was, with this lighting and camera settings, you probably wouldn’t be able to see it anyway. But there is a photo of it in operation:
The computer visualization capability was impressive for the late 1950s, but clearly pales to what was possible only a few years later. The NORAD and SAGE photographs highlight an interesting aesthetic aspect — that the dark dimness, used to such impressive effect in Dr. Strangelove, was a reality of these early systems, likely because of the contrast limitations of early projection systems.
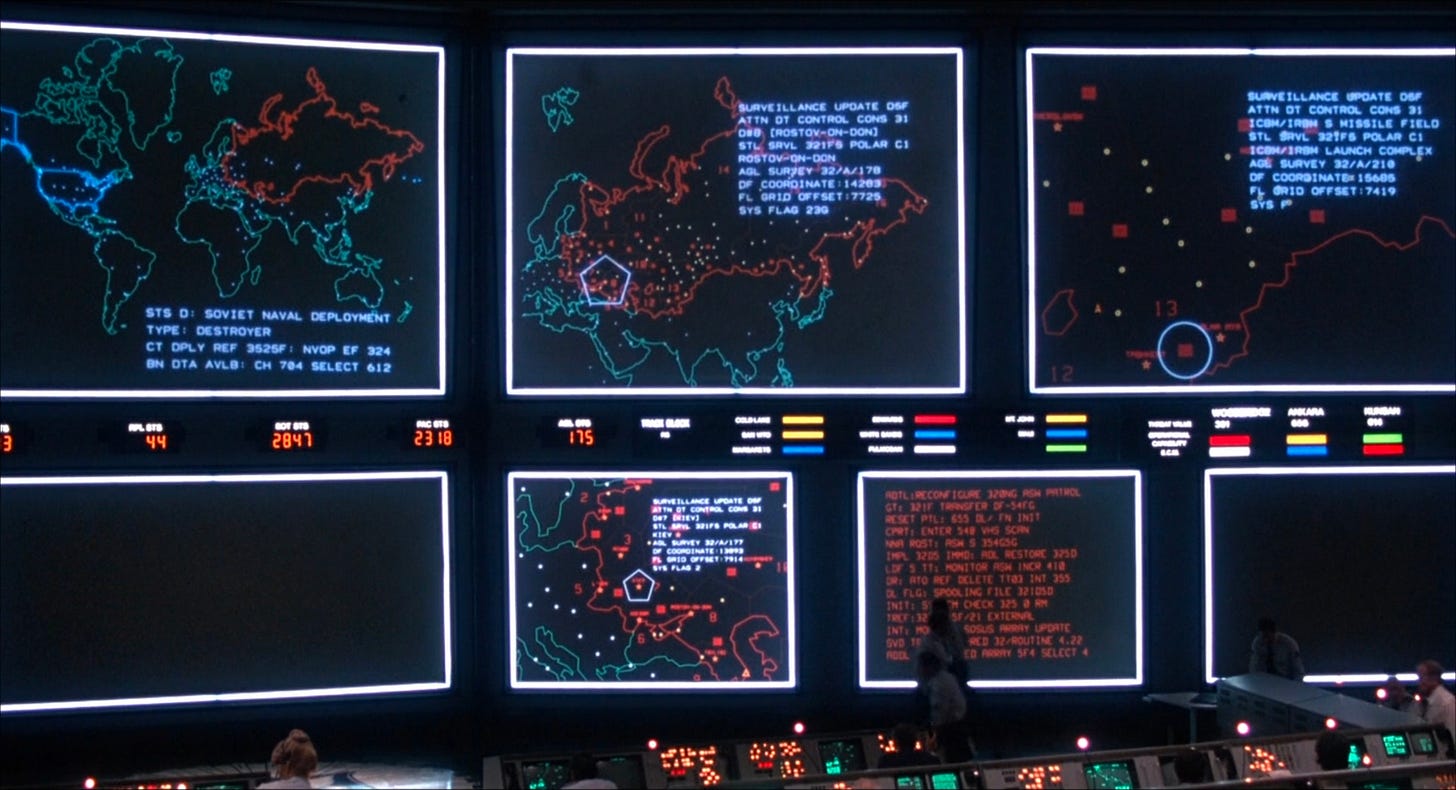
The report’s description of the “commander's box score” necessarily invokes the idea that this is some kind of game. Which, to a modern audience, necessarily invokes that other famous, cinematic Big Board, from the 1983 classic WarGames:
The stylized vectors are very iconic, and were actual computer-generated imagery, not hand-drawn fakes, being generated by HP 9845C desktop computers running BASIC, and then shot onto film, which was then projected into the scene. Effects supervisor Michael Fink described the process:7
In 1981, on WarGames with Colin [Cantwell, graphic supervisor], we printed out books of images (dot-matrix, still) representing the screen wall in the NORAD war room, showing the progression of the action through the scenes. Colin produced all the graphics for the film on HP 9845C computers, which also did the previsualizations books. This was a complex task. We had images on 12 screens covering five weeks of shooting, all working in sync with each other. […] We generated something like 50,000 feet of computer graphic-created negative[s] in 7 months or so, running 24 hours a day, seven days a week. We printed nearly 130,000 feet of film for the process projectors that put the images on the screens. The screens were specially built from a custom material for the film. All cameras, projectors, computers, and video were synchronized by a custom system (everything was custom in 1982) which kept all the images on the right frame at the right time in the right scene. On top of that we had to create the worlds brightest 24 fps strobe system for the end sequence, which was controlled by another synchronized computer system. It was the first film to have real time 24fps computer graphic displays (as crude as they now seem).
In his classic 1997 book on Cold War computing, The Closed World, historian of technology Paul Edwards argued that the computer systems developed for NORAD encouraged a fantasy and ideology of total control and total knowledge, one that was pervasive throughout US government technoscientific efforts in the Cold War. He points out the many ways in which all three of the films mentioned both participate in that fantasy while pushing strongly against it.
Because ultimately, the fantasy of control was, and still is, a fantasy: what is shown on the screen is never all that is there, and even what is there is subject to forces and circumstances beyond control. And it’s one thing if that lack of control has very local and limited consequences; it’s another thing when you’re talking about nuclear war.
Christopher Frayling, Ken Adam and the Art of Production Design (Faber and Faber, 2005), 111.
Interview with Sidney Lumet in Fail-Safe Revisited, a short documentary made as part of the promotional materials for the 2000 remake of Fail Safe.
This image was posted by NORAD to its Twitter account in August 2019.
I found this blog post very instructive on the history of Iconorama: Dave Peters, “The ICONORAMA in the Federal Warning Centre at the Central Emergency Government HQ at Canadian Forces Station Carp,” Dave’s Cold War Canada (March 2020).
US Army Air Defense School, US Army Air Defense Digest (1965), chapter 2, “Air Defense Doctrine and Procedures.”
For more on SAGE, its predecessor Project Whirlwind, and computers in the Cold War in general, see esp. Paul Edwards, The Closed World: Computers and the Politics of Discourse in Cold War America (MIT Press, 1997).
Ansgar Kückes, “Screen Art: WarGames,” The HP 9845 Project (2010). Along with interviews, this page contains just way more dorky detail on the creation of the WarGames Big Board than anyone could ever need, and is an impressive labor of love.


Speaking of games, there’s also Introversion’s DEFCON, which turns the vector maps of Wargames into, well, a wargame. The weird feeling of watching the world die in the most abstract, cold-blooded way comes across quite strongly.
From the Dowding System (with it's WRENS moving little wooden models about) forward it's amazing how much effort has gone into figuring out how to display large scale complex systems and situations... and do so in a format such that supervisory elements can reasonably comprehend and digest them and take appropriate action.